Nudge
Reimagining TV commerce with "buy now" technology
SITE DESIGN
WEB APP DESIGN | DEC 2018 - FEB 2019
PROBLEM
Nudge allows brand marketers and advertisers to place interactive product ads in OTT content. They need a streamlined, intuitive admin platform to easily manage ads and track metrics.
SOLUTION
Our team designed a flexible and well-integrated web app with a dashboard that enables users to create/edit ads and track metrics in multiple ways.
SCOPE
12 weeks
TOOLS
Sketch
InVision
TEAM
Alice Bae
John Choi
MY ROLE
Project Manager
Visual Designer
Industry Researcher

DISCOVER
Introducing Nudge
Nudge is reimagining the consumer experience on OTT (Over-the-Top) devices like Smart TV, Chromecast, and Roku. When a CTA icon appears on the screen, viewers can pause videos to see details about a featured product. Brand-side integrators use Nudge's admin platform to set up CTAs and track ad metrics.

The TV Advertising Industry
OTT devices have seen a steep increase in popularity, as ad view share grew from 6% in 2015 to 41% in 2018. OTT advertising is effective for reaching target audience groups since the platform is user-initiated and ads can be set up without skip/fast-forward functions. To gain further industry context, I analyzed several video CMS and analytics platforms, identifying key technologies and design patterns.
Metadata
Videos are tagged with rich data, building an organized content library with powerful discoverability and search functions.
Analytics
Video ad performance metrics are leveraged to improve viewer engagement and maximize ad revenue.
Cross-Screen Tracking
OTT devices enable following the user journey across connected platforms, creating a holistic view.
DEFINE
Identifying the User
The Nudge admin platform is intended for brand-side marketers and advertisers who set up and manage product CTAs. Tracking ad performance is crucial for their goals to increase reach, conversion, and ROI. They already use a variety of other analytics platforms to assess metrics and share with their teams or other stakeholders. We interviewed 3 people in marketing roles to understand their needs and current experiences of using industry tools.

Difficult to manage multiple ads simultaneously

Hard to convey the impact of metrics

Appreciate easy-to-use platforms
The Problem
How can we design an intuitive, flexible system that streamlines the marketer’s workflow for managing ads and tracking metrics?
DEVELOP
Features
Since our primary users would be using Nudge in a work environment, we chose to design a web application for desktop with data they could manipulate. The objective was to create a well-integrated platform by providing a holistic view of ads from launch through evaluation.

Streamlined "Create" Process
Ease of linking videos and products facilitates CTA setup

Search & Filter Ads
Metadata associated with each product and video makes content findable
Filter & Sort Analytics
Generate customized reports

Export CSV Report
Extract data to use with other platforms
Wireframes
Low-fidelity wireframes allowed us to experiment with layout options for each page.


"MANAGE" TAB
Vertical format: video entry shows linked products in a drop-down
OR
Horizontal format: video entry shows linked products in a sidebar
"CREATE" PAGE
Video-product flow: create video, then embed products
OR
Dual flow: user can create video or product first


Mid-fidelity wireframes were created to add details in each page.
Metadata: video length, video type, product brand, CTA time, etc.
Buttons: edit video, add product, edit product, delete product, etc.
DELIVER
Usability Tests
Our tests primarily focused on assessing the core features of our prototype: create, manage, and report analytics. We recruited participants in marketing roles to observe the user experience from an industry standpoint.
PRODUCT/VIDEO VIEW
Problem: Users didn’t know there were 2 modes of searching content
Solution: Product/Video tabs were integrated into the search bar as a drop-down menu, making it clear that users could search by product or video

ICONS
Problem: Users struggled to identify certain button functions
Solution: Minimized icon use, eliminated potentially unfamiliar symbols, and added words to label buttons
"CREATE" PAGE
Problem: Too much data in one page was overwhelming
Solution: Broke up the process into multiple steps

Final Design
The ad setup process streamlines the flow for linking new videos and products. Users have the freedom to choose to embed products in videos or the other way around.


MANAGE ADS
Videos and products are integrated in a single view with convenient search and filter functions powered by metadata
CREATE A CTA
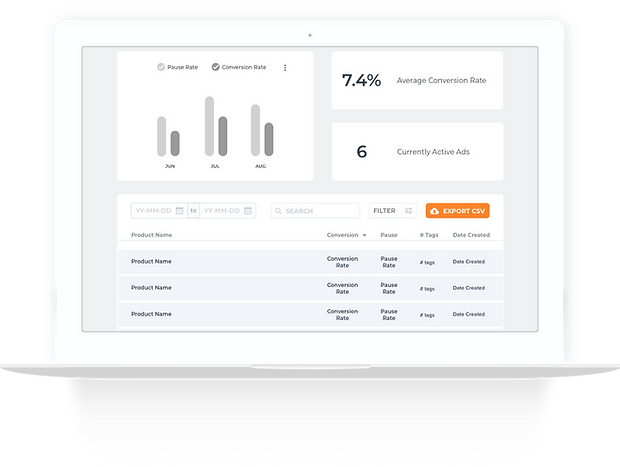
ANALYTICS
Various visual representations make ad metrics instantly readable. Filter and sort functions allow users to customize data and export CSV reports to integrate with other systems.